Unlocking Daily Fantasy: The Mathematical Edge
A guide to finding positive expected value Daily Fantasy Sports (DFS) picks. Learn how to calculate implied odds, find true probabilities, and identify market inefficiencies.

Daily Fantasy Sports (DFS) Pick'em is one of the fastest-growing and most exciting ways to play along with your favorite sports. It's fun, it's easy to understand, and its popularity has exploded. Major sportsbooks are adding it to their platforms, and new companies dedicated solely to DFS are popping up all the time. A key reason for this growth is its accessibility; DFS Pick'em is available in many states and locations where traditional sports betting isn't.
But what sets it apart from regular sports betting is how it works. Instead of picking a single team to win, on a DFS Pick'em site you build a "slip" by choosing a series of individual player stats. It's like creating a mini-fantasy team for a single game, but much simpler. The platforms are designed to be accessible, so for many props, you simply decide if the player will get Higher or Lower than the number shown.
For example, you might browse the NBA player stats and decide on the following picks:
- LeBron James: Higher than 25.5 Points
- James Harden: Higher than 8.5 Assists
- Nikola Jokic: Lower than 12.5 Rebounds
- Stephen Curry: Higher than 4.5 Three-Pointers
You combine these individual picks onto a single entry, or "slip." To win, you need to get a certain number of them correct. This is where the crucial difference lies: the payout structure.
In sports betting, the odds determine your payout. In DFS Pick'em, the payouts are fixed. For example, on PrizePicks, a "Power Play" slip has a rigid payout scheme: a 2-pick entry pays 3x, a 3-pick pays 6x, and a 4-pick pays 10x, regardless of which players or stats you choose. This fixed-payout model is the key, and it's where SmartStake's analytical approach begins.
The Hidden Math: Finding Implicit Odds in DFS
If DFS platforms don't show you odds, how can you know if a pick is good value?
The answer lies in the fixed payouts. Every payout structure has a "break-even" percentage baked in—a minimum win rate each of your picks needs to hit for you to be profitable in the long run. This is the implicit odds of the slip.
For a simple "all-or-nothing" slip (often called a "Power Play"), we can calculate this with a straightforward formula:
Break-Even % = (1 / Payout Multiplier) ^ (1 / Number of Picks)
Let's break that down with a real example: A PrizePicks 2-Pick Power Play, which pays 3x your investment if both picks win.
- Payout Multiplier (P): 3
- Number of Picks (n): 2
Break-Even % = (1 / 3)^(1 / 2) = 0.577 or 57.7%
This number is your north star. It means that to be profitable, each of your two picks must have a true win probability of more than 57.7%.
Of course, not all slips are all-or-nothing. "Flex" or "Insured" slips introduce a safety net, offering partial payouts if you miss one or two legs. This changes the math. The simple formula no longer applies because we have to account for multiple winning scenarios. The calculation becomes a more complex expected value equation, factoring in the probability and payout of hitting 5/5, 4/5, and 3/5 picks, for example. But the core principle remains: because the payouts are fixed, a single break-even win percentage can still be determined for each leg.
At SmartStake, we've done the math for you. Here’s a look at the break-even percentages for some popular slip types across different platforms:
| Platform | Slip Type | Break-Even % Per Leg |
|---|---|---|
| PrizePicks | 2-Pick Power | 57.6% |
| PrizePicks | 3-Pick Power | 55.0% |
| PrizePicks | 5-Pick Flex | 54.3% |
| PrizePicks | 6-Pick Flex | 54.3% |
| Underdog | 2-Pick Non-Insured | 57.6% |
| Underdog | 5-Pick Insured | 54.8% |
| Underdog | 6-Pick Insured | 53.7% |
| Dabble | 3-Pick Insured | 59.0% |
| Dabble | 8-Pick Insured | 56.5% |
| Betr | 3-Pick Non-Insured | 58.5% |
| Betr | 8-Pick Non-Insured | 56.3% |
The break-even threshold is a complex function of each platform's specific payout structure. As you can see, it doesn't always follow a simple downward pattern as more picks are added. However, there are clear "sweet spots." For example, 5- and 6-pick 'Flex' or 'Insured' slips on platforms like PrizePicks and Underdog often have some of the lowest thresholds—especially Underdog's 6-pick insured at 53.7%—making them of analytical interest when evaluating +EV opportunities.
Finding the "True" Win Probability
So, we know the bar we need to clear. A 6-pick insured slip on Underdog requires each leg to win at least 53.7% of the time. But how do we know the actual probability of a player getting over their point total?
SmartStake does it the same way value is estimated in sports betting: by estimating the "true price" of the market. As explained in SmartStake's Positive EV Betting Guide, the betting market has "sharp" bookmakers (like Pinnacle) whose odds SmartStake trusts as a benchmark for an event's estimated true probability.
Our process is:
- Find the Odds: We take the odds for a specific player prop from the sharpest sportsbooks.
- Remove the Juice: We de-vig the line to strip out the bookmaker's built-in margin. If you're new to this concept, our De-Vigging Guide explains it in detail.
- Calculate True Probability: The result is the unbiased, true probability of that prop hitting.
For example, if Pinnacle has odds of -135 on "LeBron James OVER 25.5 points," the de-vigged, true probability might be around 56%.
Finding the Edge
This is where the strategy comes to life. We compare the break-even percentage required by the DFS platform to the true win probability we found from the sharp books.
If True Win Probability > DFS Break-Even Probability, you have found a +EV pick.
Let's use our examples:
- DFS Platform Requirement: An Underdog 6-Pick Insured needs each leg to win 53.7% of the time.
- Our Prop's True Probability: We found that "LeBron OVER 25.5 points" has a true win rate of 56%.
Since 56% > 53.7%, this pick has a positive expected value and may be worth including in your slip.
The Multiplier Effect: Why Small Edges Win Big
You might be thinking, "A 2.3% edge seems tiny. Is that really worth it?"
Absolutely. In a parlay, these small edges don't just add up—they compound. You're not placing one bet with a 2.3% edge; you're placing six independent bets that are all mispriced in your favor. This creates a significant advantage on the overall slip.
Let's illustrate with our 5-pick flex example. A PrizePicks 5-pick flex pays 10x for 5/5 correct, 2x for 4/5, and 0.4x for 3/5. The break-even rate is 54.3%.
Now, imagine we build a slip with five picks that each have a true win probability of 57%. That's a solid edge over the 54.3% break-even. When we run the numbers through an expected value formula, the compounding effect becomes meaningful.
The math suggests a theoretical positive expected return under these assumptions — but expected value is a long-run statistical measure, not a prediction of what any single slip will return. Individual slips can win or lose; variance is high; and the calculation depends on the true probability estimates being accurate. Actual results vary significantly and are never guaranteed.
The Final Layer: Stacking with Promotions
The last piece of the puzzle is promotions. DFS sites constantly offer deposit matches, payout boosts, and "free squares" (a prop with a near-100% chance of hitting). When you combine a +EV strategy with a promotional offer, the promotional value can further improve your expected return.
Making it Easier with the SmartStake Optimizer
Manually finding sharp odds, de-vigging them, and comparing them to every possible slip combination is a lot of work. That's why SmartStake built the SmartStake Daily Fantasy Optimizer to do the heavy lifting for you.
Please note: Examples and screenshots in this guide are illustrative. Actual results vary significantly and are never guaranteed. DFS involves variance and execution risk. Only use disposable income. SmartStake is not affiliated with any DFS platform.
We've simplified the entire process into a few clicks. Here’s how it works:
-
Select Your Platform: Choose your favorite DFS site, like PrizePicks or Dabble, from our list.
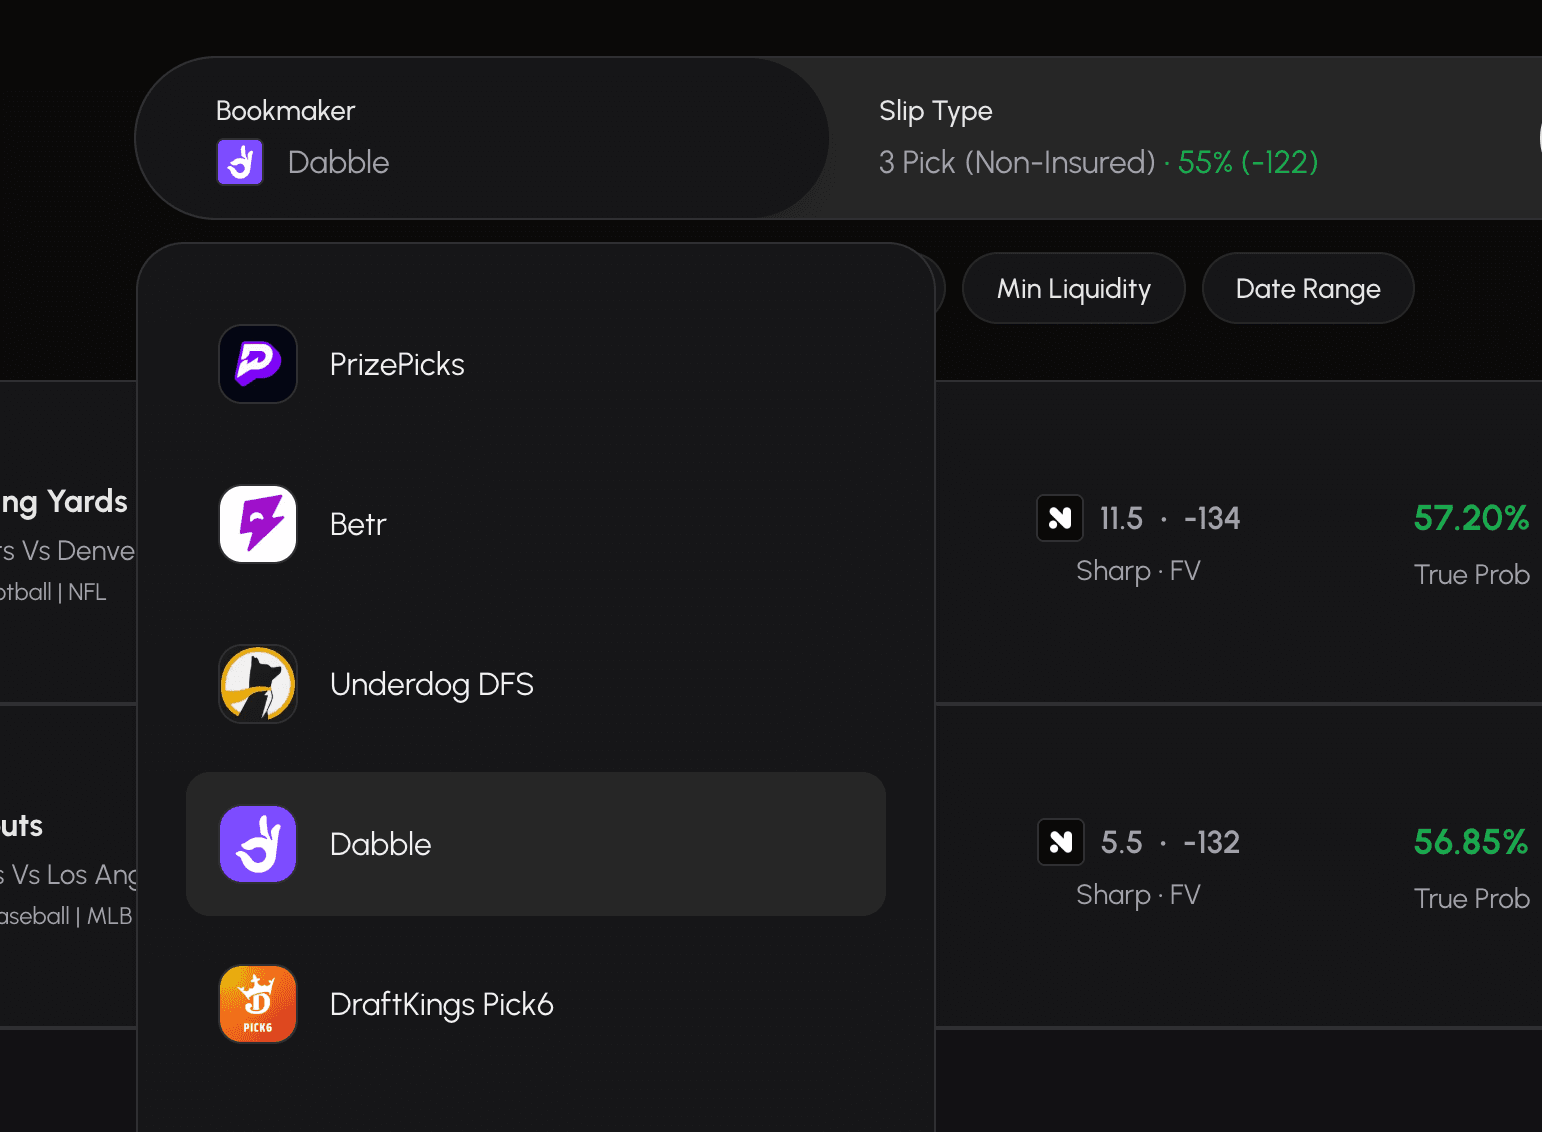
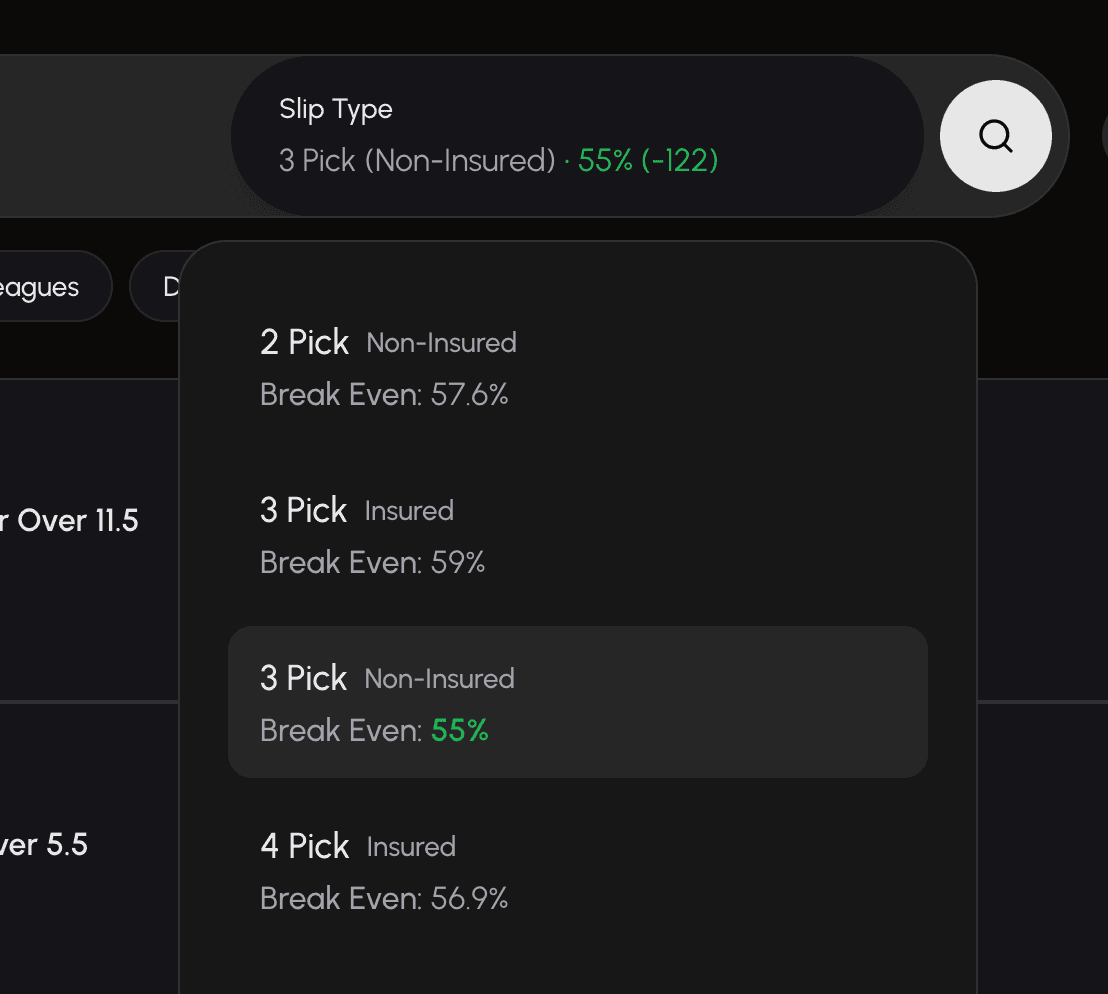
-
Choose Your Slip: Select the entry type you want to play (e.g., "6-Pick Flex"). Our tool automatically displays the break-even percentage for that slip, highlighting the ones with the lowest thresholds in green—these are your targets.
- Find Your Edge: We then show you a list of all available player props on that platform. Next to each one, you'll see its True Probability, calculated in real-time from the sharpest sportsbooks.
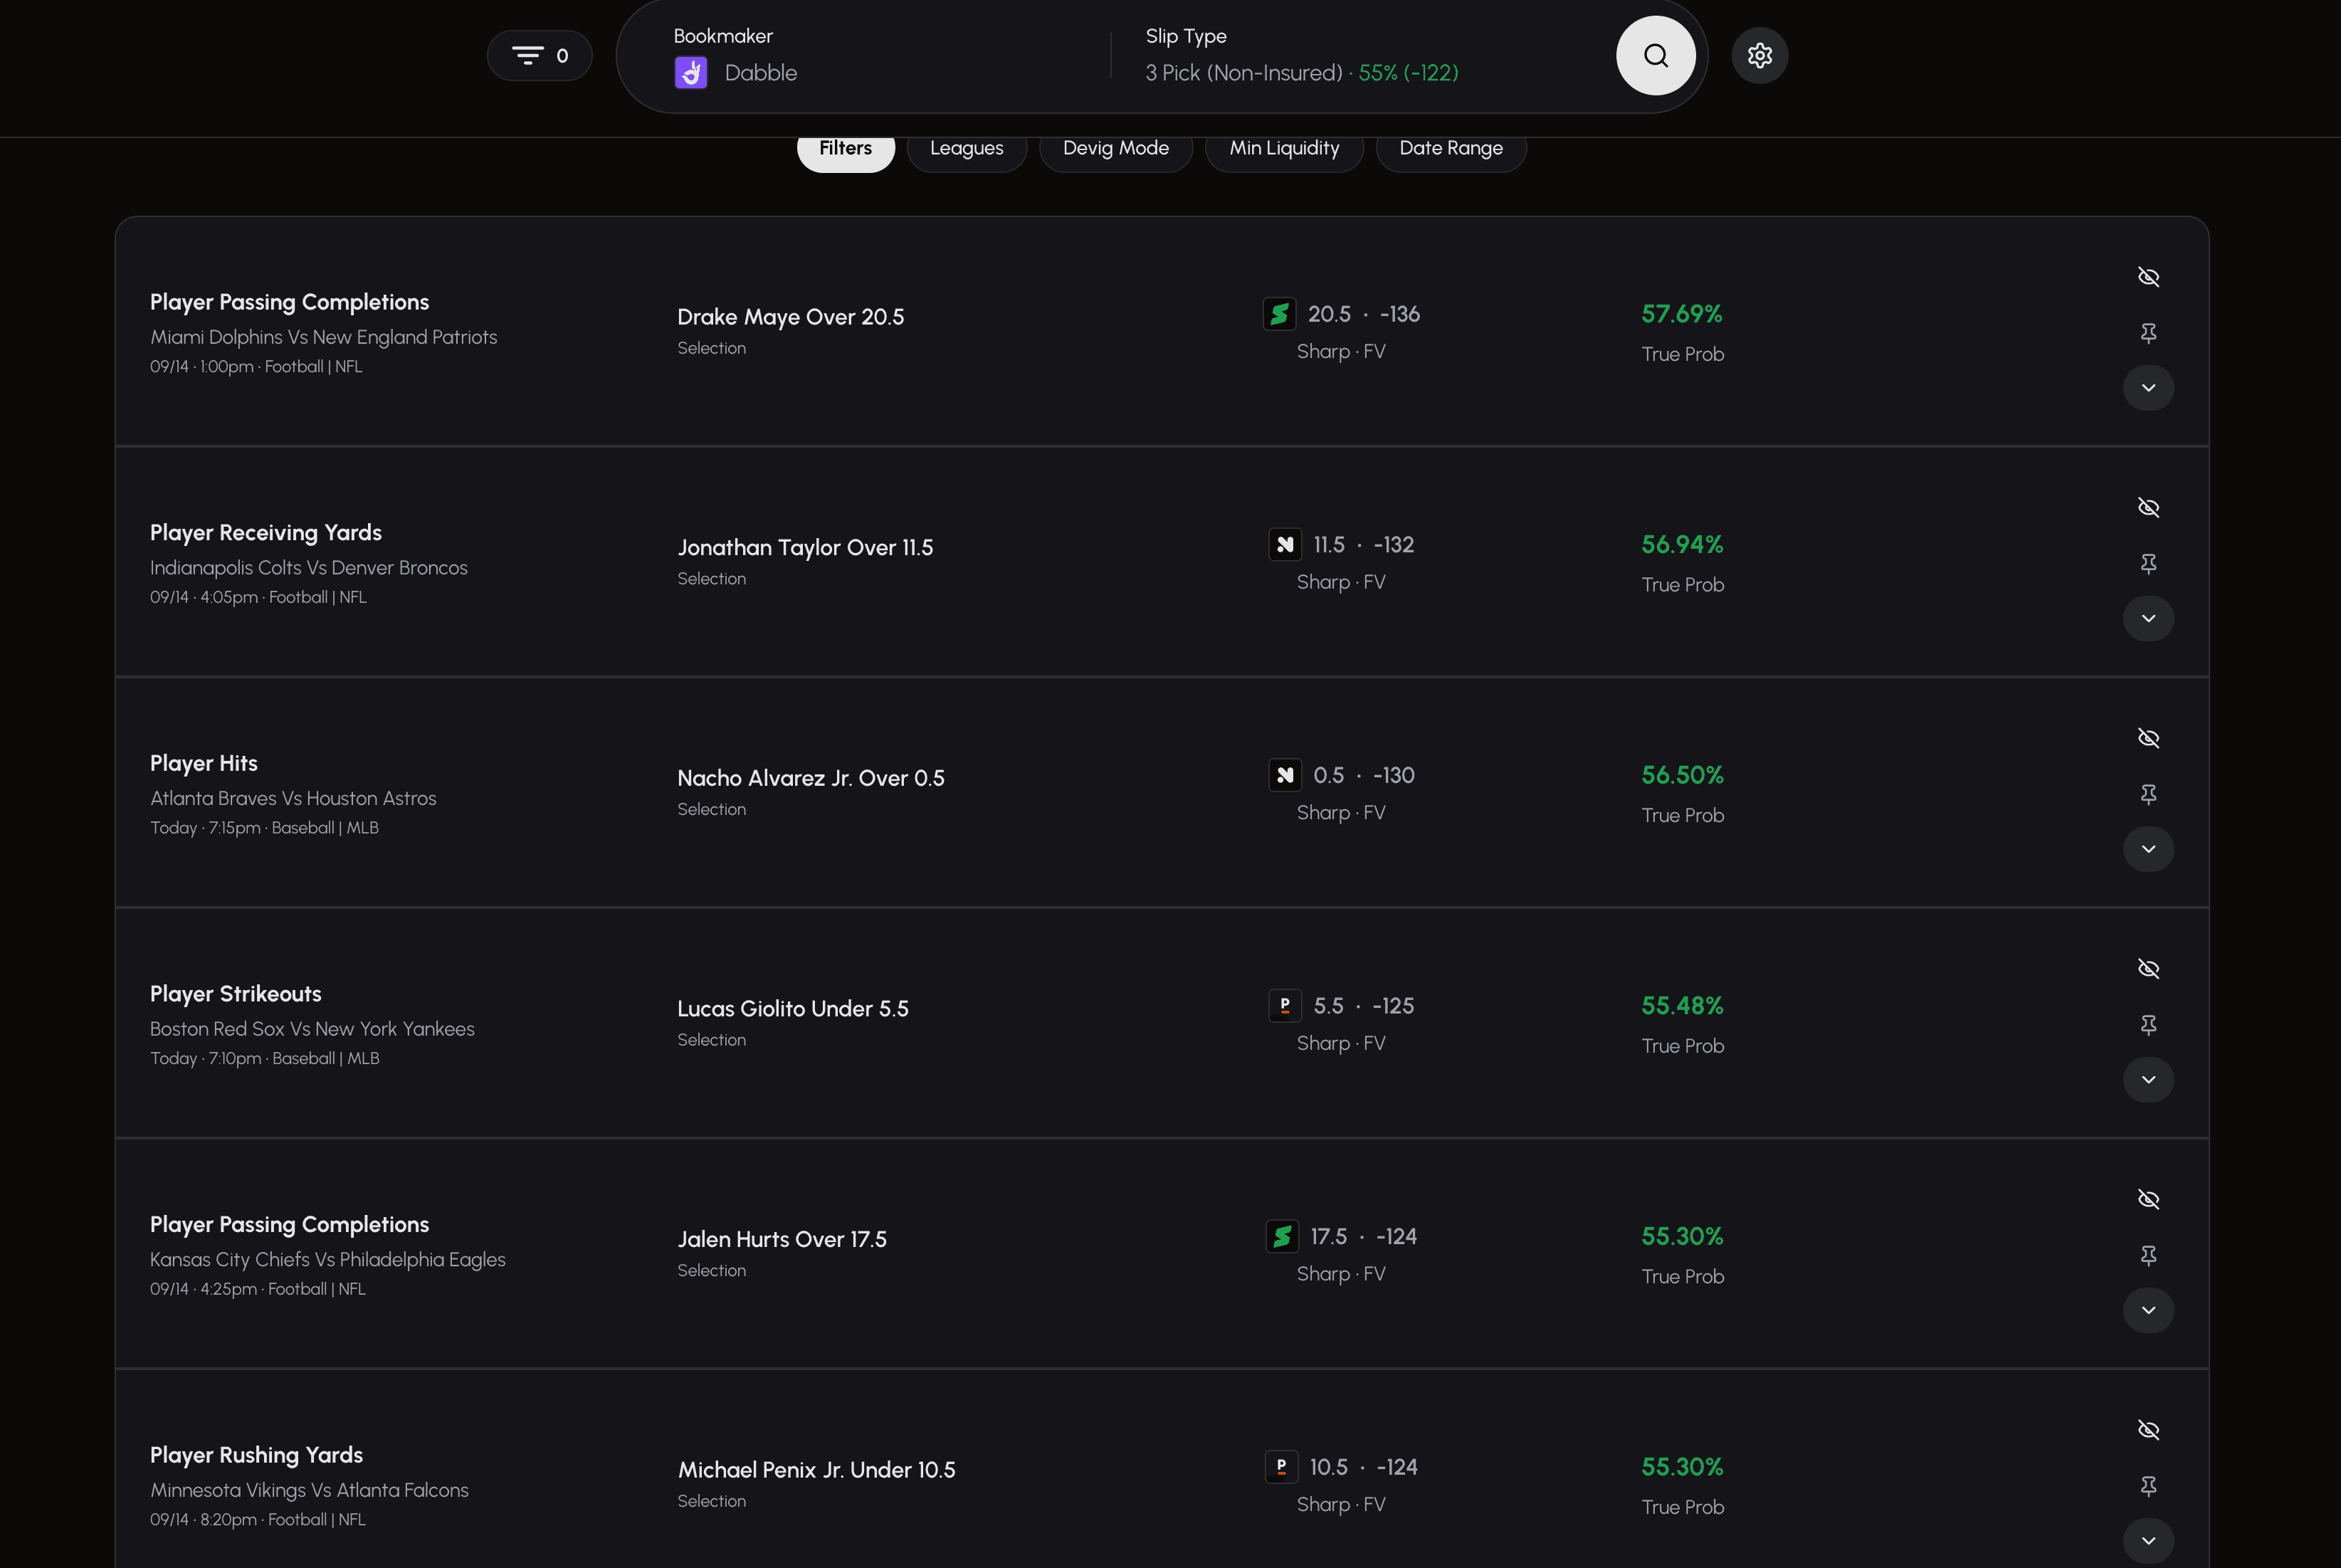
- Build Your Slip: The best part? Any prop where the True Probability is higher than the break-even percentage is highlighted in green. Simply pick from the green-lit props to build your +EV slip.
Instead of hunting for value, you get a live feed of candidate +EV picks. SmartStake surfaces the data — you make the decisions. Individual slips can win or lose, and results are never guaranteed.
Get Started Today and See How Simple +EV DFS Can Be.
Video Guide: Using the Daily Fantasy Optimizer
Now that you understand the math behind DFS, watch our video guide to see how to use the SmartStake Daily Fantasy Optimizer to find and build your +EV slips.
This content is for educational and informational purposes only and is not financial, investment, or betting advice. Sports betting carries risk and outcomes are never guaranteed — only stake what you can afford to lose, and bet responsibly.
Get the next guide in your inbox
Practical betting guides, new tools, and product updates from the SmartStake team. Unsubscribe in one click, any time.
By providing your email, you are consenting to receive communications from SmartStake. Visit our Privacy Policy for more info
Similar articles
Strategy
WNBA DFS Picks and Strategy: Finding the Real Edge
WNBA DFS Picks and Strategy: Finding the Real Edge
The WNBA is a thinner, less-watched market than the NBA, which leaves more mispriced player props on the pick'em boards. This guide covers the WNBA-specific factors that move points, rebounds, and assists, and how to turn them into +EV picks.
Jul 25, 2026 · 9 min read

StrategyFantasy
Best DFS Pick'em Optimizer Tools in 2026: 6 Ranked
A hands-on comparison of the best DFS pick'em optimizer tools in 2026, judged on what actually finds an edge: a devigging engine, per-slip break-even math, pick'em app coverage, entry placement, tracking, and price. We rank SmartStake, OddsJam, Outlier, Props.Cash, Stokastic, and Prop Professor.
Jul 22, 2026 · 12 min read

StrategyFantasy
How to Beat PrizePicks: The Math Behind +EV Pick'em
PrizePicks is a fixed-payout game, which means every slip has a break-even win rate hidden in its multiplier. This guide shows the exact numbers, where the margin lives, and how to find picks whose true probability clears the bar.
Jun 29, 2026 · 12 min read