The Sharp Bettor's Playbook: A Guide to Positive EV
Learn how to find positive expected value (+EV) bets by leveraging sharp bookmaker odds. A complete guide to +EV betting strategy.
A common framing of +EV sports betting is that it isn't about picking more winners — it's about consistently looking for better prices over a large sample. The betting market includes two kinds of sportsbooks: "sharp" books that act as market makers, and "soft" books that cater to recreational players. Understanding this difference is foundational to the strategy. +EV betting is not risk free, individual bets can win or lose, and results are never guaranteed.
Sharp books, with Pinnacle being a prime example, operate on low margins and welcome large bets from research syndicates. They use this "sharp action" to refine their odds, and SmartStake trusts their lines as a benchmark for an event's estimated true probability. Soft books (like DraftKings or Bet365) have higher margins and manage their risk by limiting or banning successful bettors. Which books are sharpest can also vary by sport: our MLB player prop data study found prediction markets like Kalshi and ProphetX lead there.
SmartStake's approach: SmartStake trusts the sharp Pinnacle line as a benchmark. By comparing Pinnacle's efficient odds to the slower, softer lines at recreational books, you can try to spot pricing differences and place bets with what may be a mathematical edge. This is called Positive Expected Value (+EV) betting. You should review any sharp book's record for yourself and pick the one you trust most.
Please note: Any examples in this guide are illustrative and based on the data shown at one point in time. They do not represent any individual user's results. +EV betting involves variance, requires placing trust in a sharp book, and outcomes are never guaranteed. Only use disposable income.
Why SmartStake Trusts Sharp Books
Choosing one sportsbook as a benchmark is a significant decision, so let's look at the public data behind it.
Researchers analyzed thousands of real golf matchups to see how well a bookmaker's odds correlated with real-world profits 1. They grouped bets based on their expected profitability and then checked the actual results. Below is what the public data shows for Pinnacle and DraftKings.
Pinnacle Bets
| Expected Profit | Actual Profit |
|---|---|
| –12.6% | –13.9% |
| –8.9% | –9.3% |
| –6.9% | –5.4% |
| –5.0% | –5.8% |
| –3.1% | –2.5% |
| –1.1% | –3.6% |
| 0.8% | 0.6% |
| 4.5% | 3.7% |
DraftKings Bets
| Expected Profit | Actual Profit |
|---|---|
| –13.8% | –9.3% |
| –8.9% | –8.5% |
| –7.0% | –5.7% |
| –5.0% | –5.0% |
| –3.0% | –4.0% |
| –1.1% | –2.5% |
| 0.9% | –5.3% |
| 5.6% | –4.1% |
In plain English: Look at the bottom row. When Pinnacle's odds suggested a group of bets had an expected profit of +4.5%, those bets actually returned +3.7% in the dataset. That is a strong correlation in the data analyzed.
Compare this to DraftKings' odds. When DraftKings suggested a group of bets had an expected profit of +5.6%, those bets actually lost 4.1% on average in the dataset. Compared to other books in the data, Pinnacle's odds were well-calibrated to actual outcomes.
A separate study by Football-Data.co.uk analyzed nearly 88,000 betting odds. It found a close correlation between the expected profit (calculated from Pinnacle's final closing odds) and the actual profit bettors achieved in the dataset 2.
What this means: The public studies cited above point to the same conclusion: based on this research, SmartStake trusts Pinnacle's closing line as a benchmark for an event's estimated true probability. The studies suggest giving significant weight to Pinnacle's odds when building a predictive model 1. Past performance in research datasets does not guarantee future results. You should review the public data and pick the sharp book you trust most.
Estimating the True Price
Now that SmartStake has explained why it trusts Pinnacle's odds as a benchmark, how do you use them to look for potentially profitable bets? First, you have to understand and remove the bookmaker's built-in margin, known as the "vig" or "juice." This process is called "de-vigging."
Think of it this way: when a bookmaker offers odds, they're not just telling you the fair price — they're marking it up like a store selling products. Here's what's happening:
-
Implied Probability: To calculate the implied probability from decimal odds, use the formula: Implied Probability (%) = 1 divided by the odds. For example, if the odds are 2.00, the implied probability is 1 divided by 2.00, which equals 0.5, or 50%. This means the bookmaker is suggesting there's a 50% chance of that outcome happening.
-
The Markup Problem: If you add up all the implied probabilities from a bookmaker's odds, they always total more than 100%. This extra percentage is their profit margin (the "vig").
-
Estimating the True Price: To remove the markup, you divide each team's probability by the total. If Lakers are 47% and Warriors are 54% (totaling 101%), the estimated true probabilities are: Lakers 47÷101 = 46.5%, Warriors 54÷101 = 53.5%. Now they add up to 100%.
-
The Opportunity: Once you have an estimate of the fair odds, you can shop around at other bookmakers. If you find one offering better odds than the estimated fair price, you have found a potential +EV bet — though the bet itself can still win or lose.
A Worked Example
Let’s walk through a simple example with a Lakers vs Warriors game:
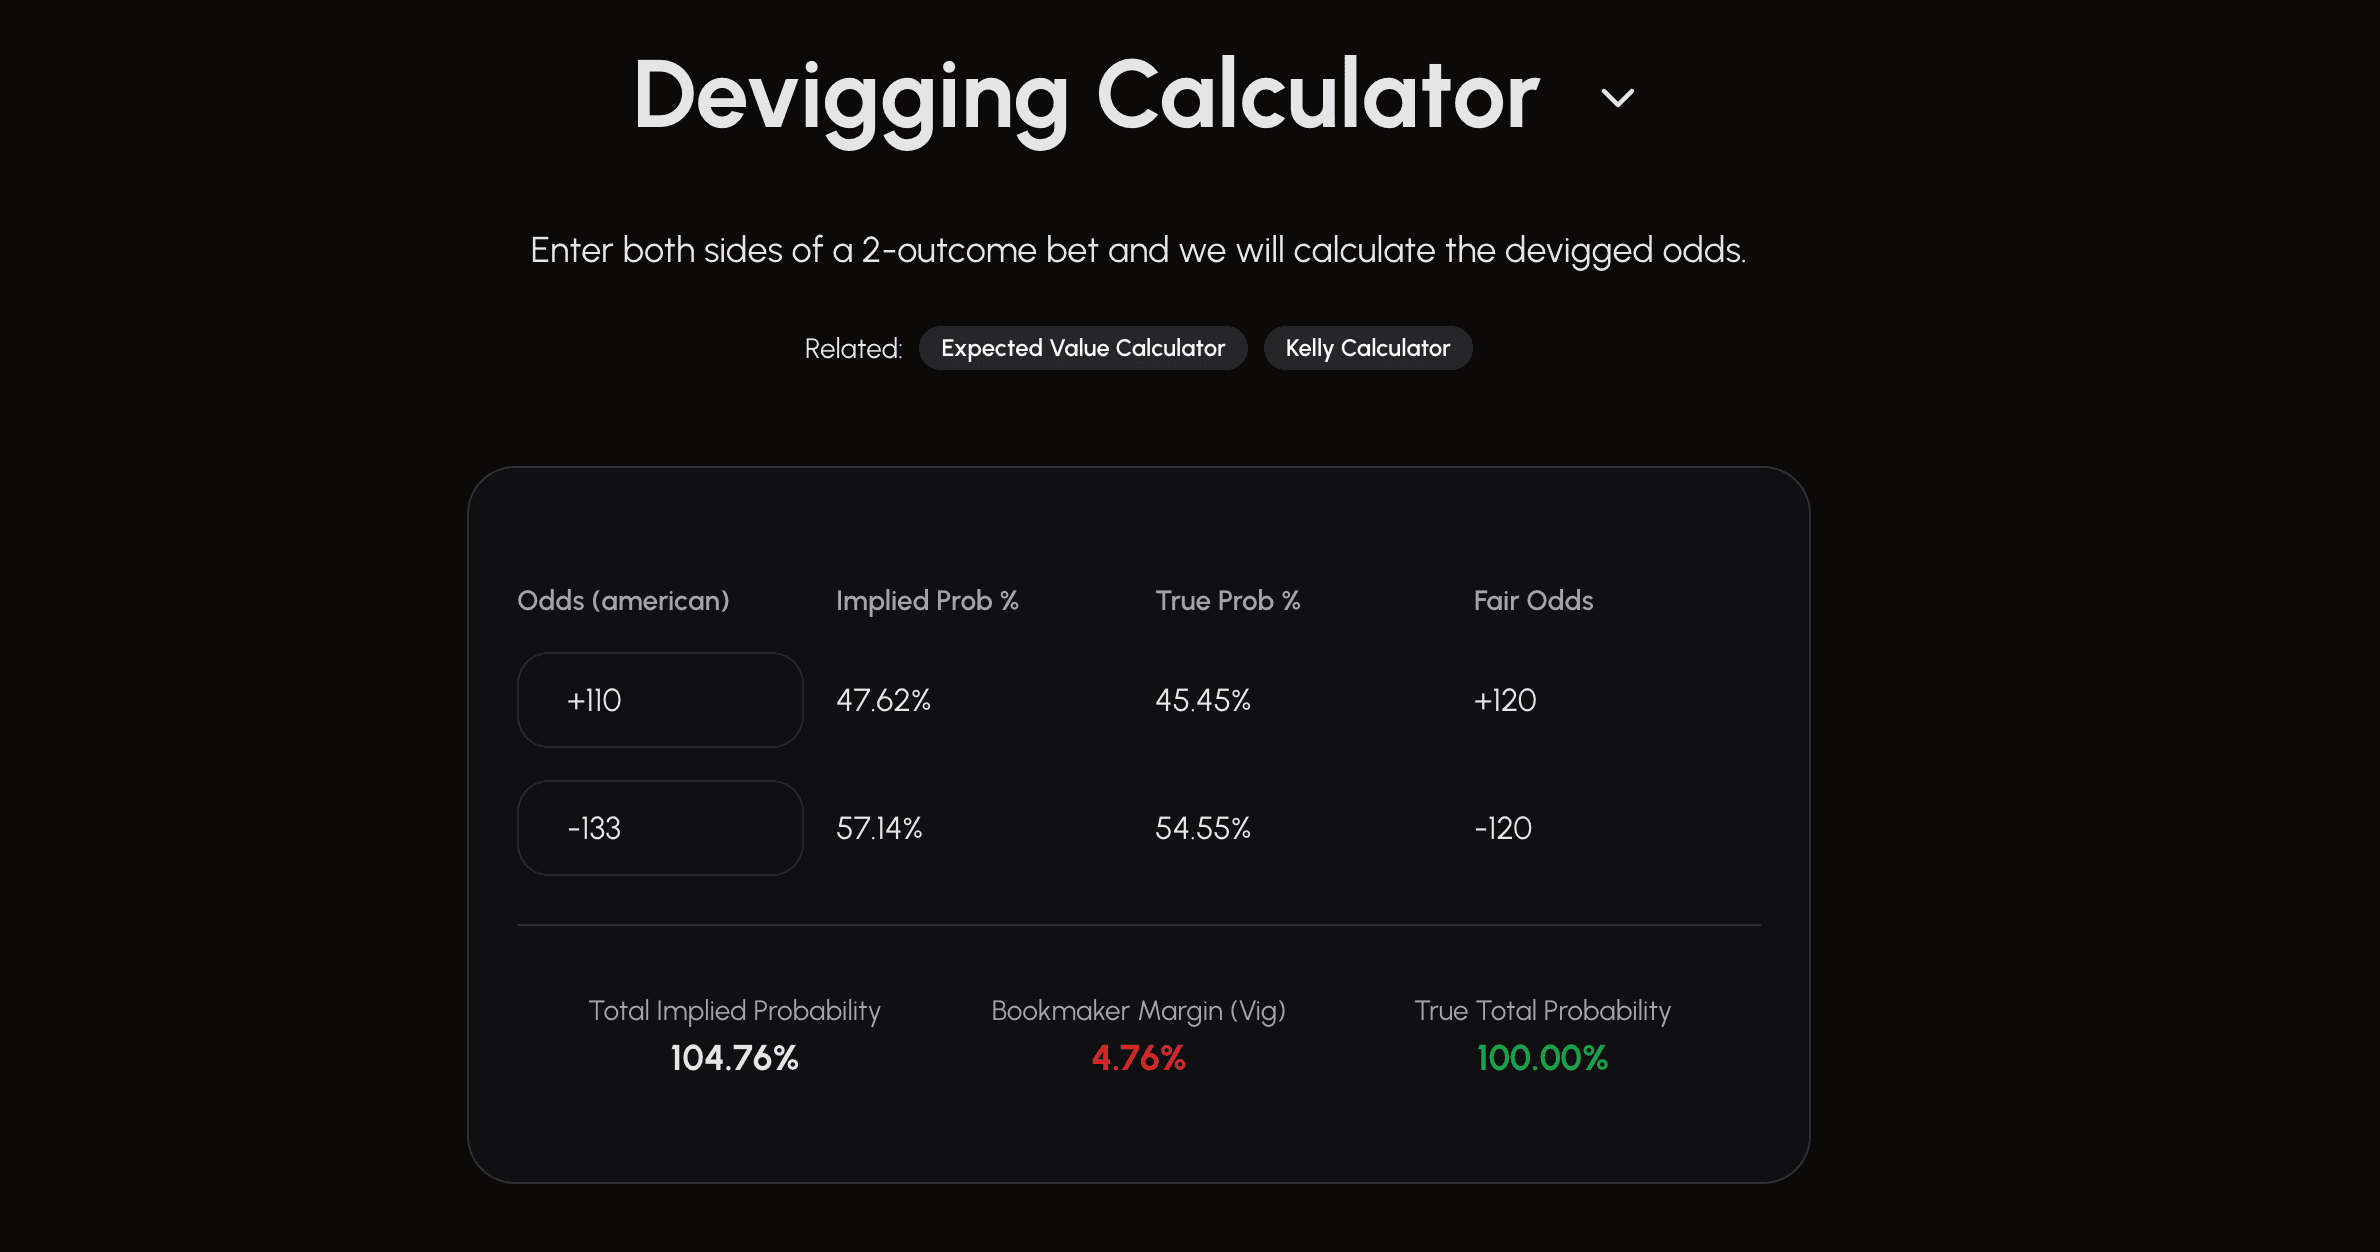
Let's say we get offered the following odds from a sharp bookmaker: Lakers to win at 2.10 (+110), Warriors to win at 1.75 (-133). (Note: feel free to switch these to American odds using the interactive calculator below.)
Convert to implied probabilities:
- Lakers: 1 ÷ 2.10 = 47.62%
- Warriors: 1 ÷ 1.75 = 57.14%
Total implied probability = 104.76% (≈ 4.76% vig)
Remove the vig (de-vigging):
- Lakers: 47.62 ÷ 104.76 = 45.48%
- Warriors: 57.14 ÷ 104.76 = 54.52%
Total = 100%
Fair odds (true price):
- Lakers: 1 ÷ 0.4548 = 2.20
- Warriors: 1 ÷ 0.5452 = 1.83
These fair odds represent the true probability of each outcome without any bookmaker margin. Now you can shop around at other sportsbooks — any line better than 2.20 on the Lakers or better than 1.83 on the Warriors is a +EV opportunity.
Odds
True Prob %
45.45%
54.55%
Fair Odds
+120
-120
Odds
True Prob %
Fair Odds
45.45%
+120
54.55%
-120
Total Implied Probability
104.76%
Bookmaker Margin (Vig)
4.76%
Implied Probability: What the bookmaker's odds suggest each outcome's chance is (1 ÷ odds)
Bookmaker Margin: The extra percentage above 100% that represents the bookmaker's built-in profit
True Probability: The fair probability after removing the bookmaker's margin
Fair Odds: What the odds would be without any bookmaker margin
Spotting a +EV Line
In the opening example, Pinnacle offers:
- Lakers to win at 2.04
- Warriors to win at 1.82
After de-vigging, these become the estimated true odds:
| Team | Pinnacle Odds | Estimated True Odds |
|---|---|---|
| Lakers | 2.10 | 2.20 |
| Warriors | 1.75 | 1.83 |
Next, you shop these estimated true odds at other sportsbooks to find any +EV lines. Here is a hypothetical snapshot:
| Team | Pinnacle Odds | True Odds | BetMGM (EV) | DraftKings (EV) | FanDuel (EV) |
|---|---|---|---|---|---|
| Lakers | 2.10 | 2.20 | 2.4 (+9.1%) | 2.10 (−4.6%) | 2.22 (+0.9%) |
| Warriors | 1.75 | 1.83 | 1.88 (+2.6%) | 1.80 (−1.8%) | 1.90 (+3.6%) |
SmartStake calculates EV per unit stake using:
where p is the estimated true win probability (eg. 0.4716 for the Lakers) and o is the odds offered by the sportsbook.
Any line above the estimated true odds is a candidate +EV opportunity — though individual bets can still lose. In this hypothetical snapshot, FanDuel offers an estimated edge on the Lakers at +2.81% EV, while BetMGM offers an estimated edge on the Warriors at +1.47% EV. Here is an interactive example where you can change the Pinnacle odds and see the EV at other books, or change the odds at other books and see the resulting EV.
EV Comparison Tool
Lakers
Warriors
Pinnacle Odds
True Odds
2.20
1.83
BetMGM
(+9.09%)
(+2.55%)
DraftKings
(-4.55%)
(-1.82%)
FanDuel
(+0.91%)
(+3.64%)
Modeling Expected Returns
Now that the theory is covered, here is how to model possible long-run returns: what does the math suggest about +EV betting outcomes?
The answer depends on three key factors: your bet size, how often +EV opportunities appear in your market, and your estimated edge size. The example below uses the hypothetical BetMGM Lakers line with +9.1% EV. This is a theoretical illustration only and not a prediction of your results — individual bets can win or lose, and you can lose your bankroll.
Positive EV Earnings Calculator
Based on BetMGM Lakers line with +9.1% EV
$
100
100
Per Bet Breakdown
If you win (45.5% chance):
+$140 profit
If you lose (54.5% chance):
-$100 loss
Long-Term Results (100 bets)
Wins: 45
Total won: $6300
Losses: 55
Total lost: $5500
Total Wagered
$10000
Net Profit
$800
ROI
8.0%
The more bets you place, the closer your actual results get to the expected 9.10% profit per bet.
The De-Vigging Calculator
Want to find out if a bet is +EV? Use our free De-Vigging Calculator. Just enter both sides of a 2-outcome bet and it will calculate the true odds of each outcome. Then, just compare the true odds to the odds at other sportsbooks to see if you can find a +EV opportunity. If the odds from the other sportsbook are higher than the true odds, you've found a +EV opportunity.
Finding +EV in Practice
This sounds great, but you might be wondering: are these numbers just theoretical? How often do sportsbooks really have odds that are different enough to matter?
The truth is, significant discrepancies between sharp and soft books appear daily. However, these opportunities are fleeting. The betting market is an ecosystem. When a soft book posts a line with a high EV, sharp bettors and syndicates quickly place large wagers on it. This influx of money signals to the bookmaker that their line is off-market. In response, they rapidly adjust the odds to reduce their liability, and the +EV opportunity vanishes — often in minutes or even seconds.
So, while these profitable bets are real, they aren't always easy to find manually. Speed is everything.
Automating the Search
Manually comparing dozens of sportsbooks across hundreds of games is a monumental task. By the time you find an edge, it might already be gone. That’s why we built a tool that does the hard work for you.
Our platform scrapes over 80 sportsbooks in real-time, 24/7. We de-vig the Pinnacle line and compare it against every other book to surface +EV opportunities the second they appear. Instead of manually comparing lines, you get a live feed of +EV bets delivered directly to you.
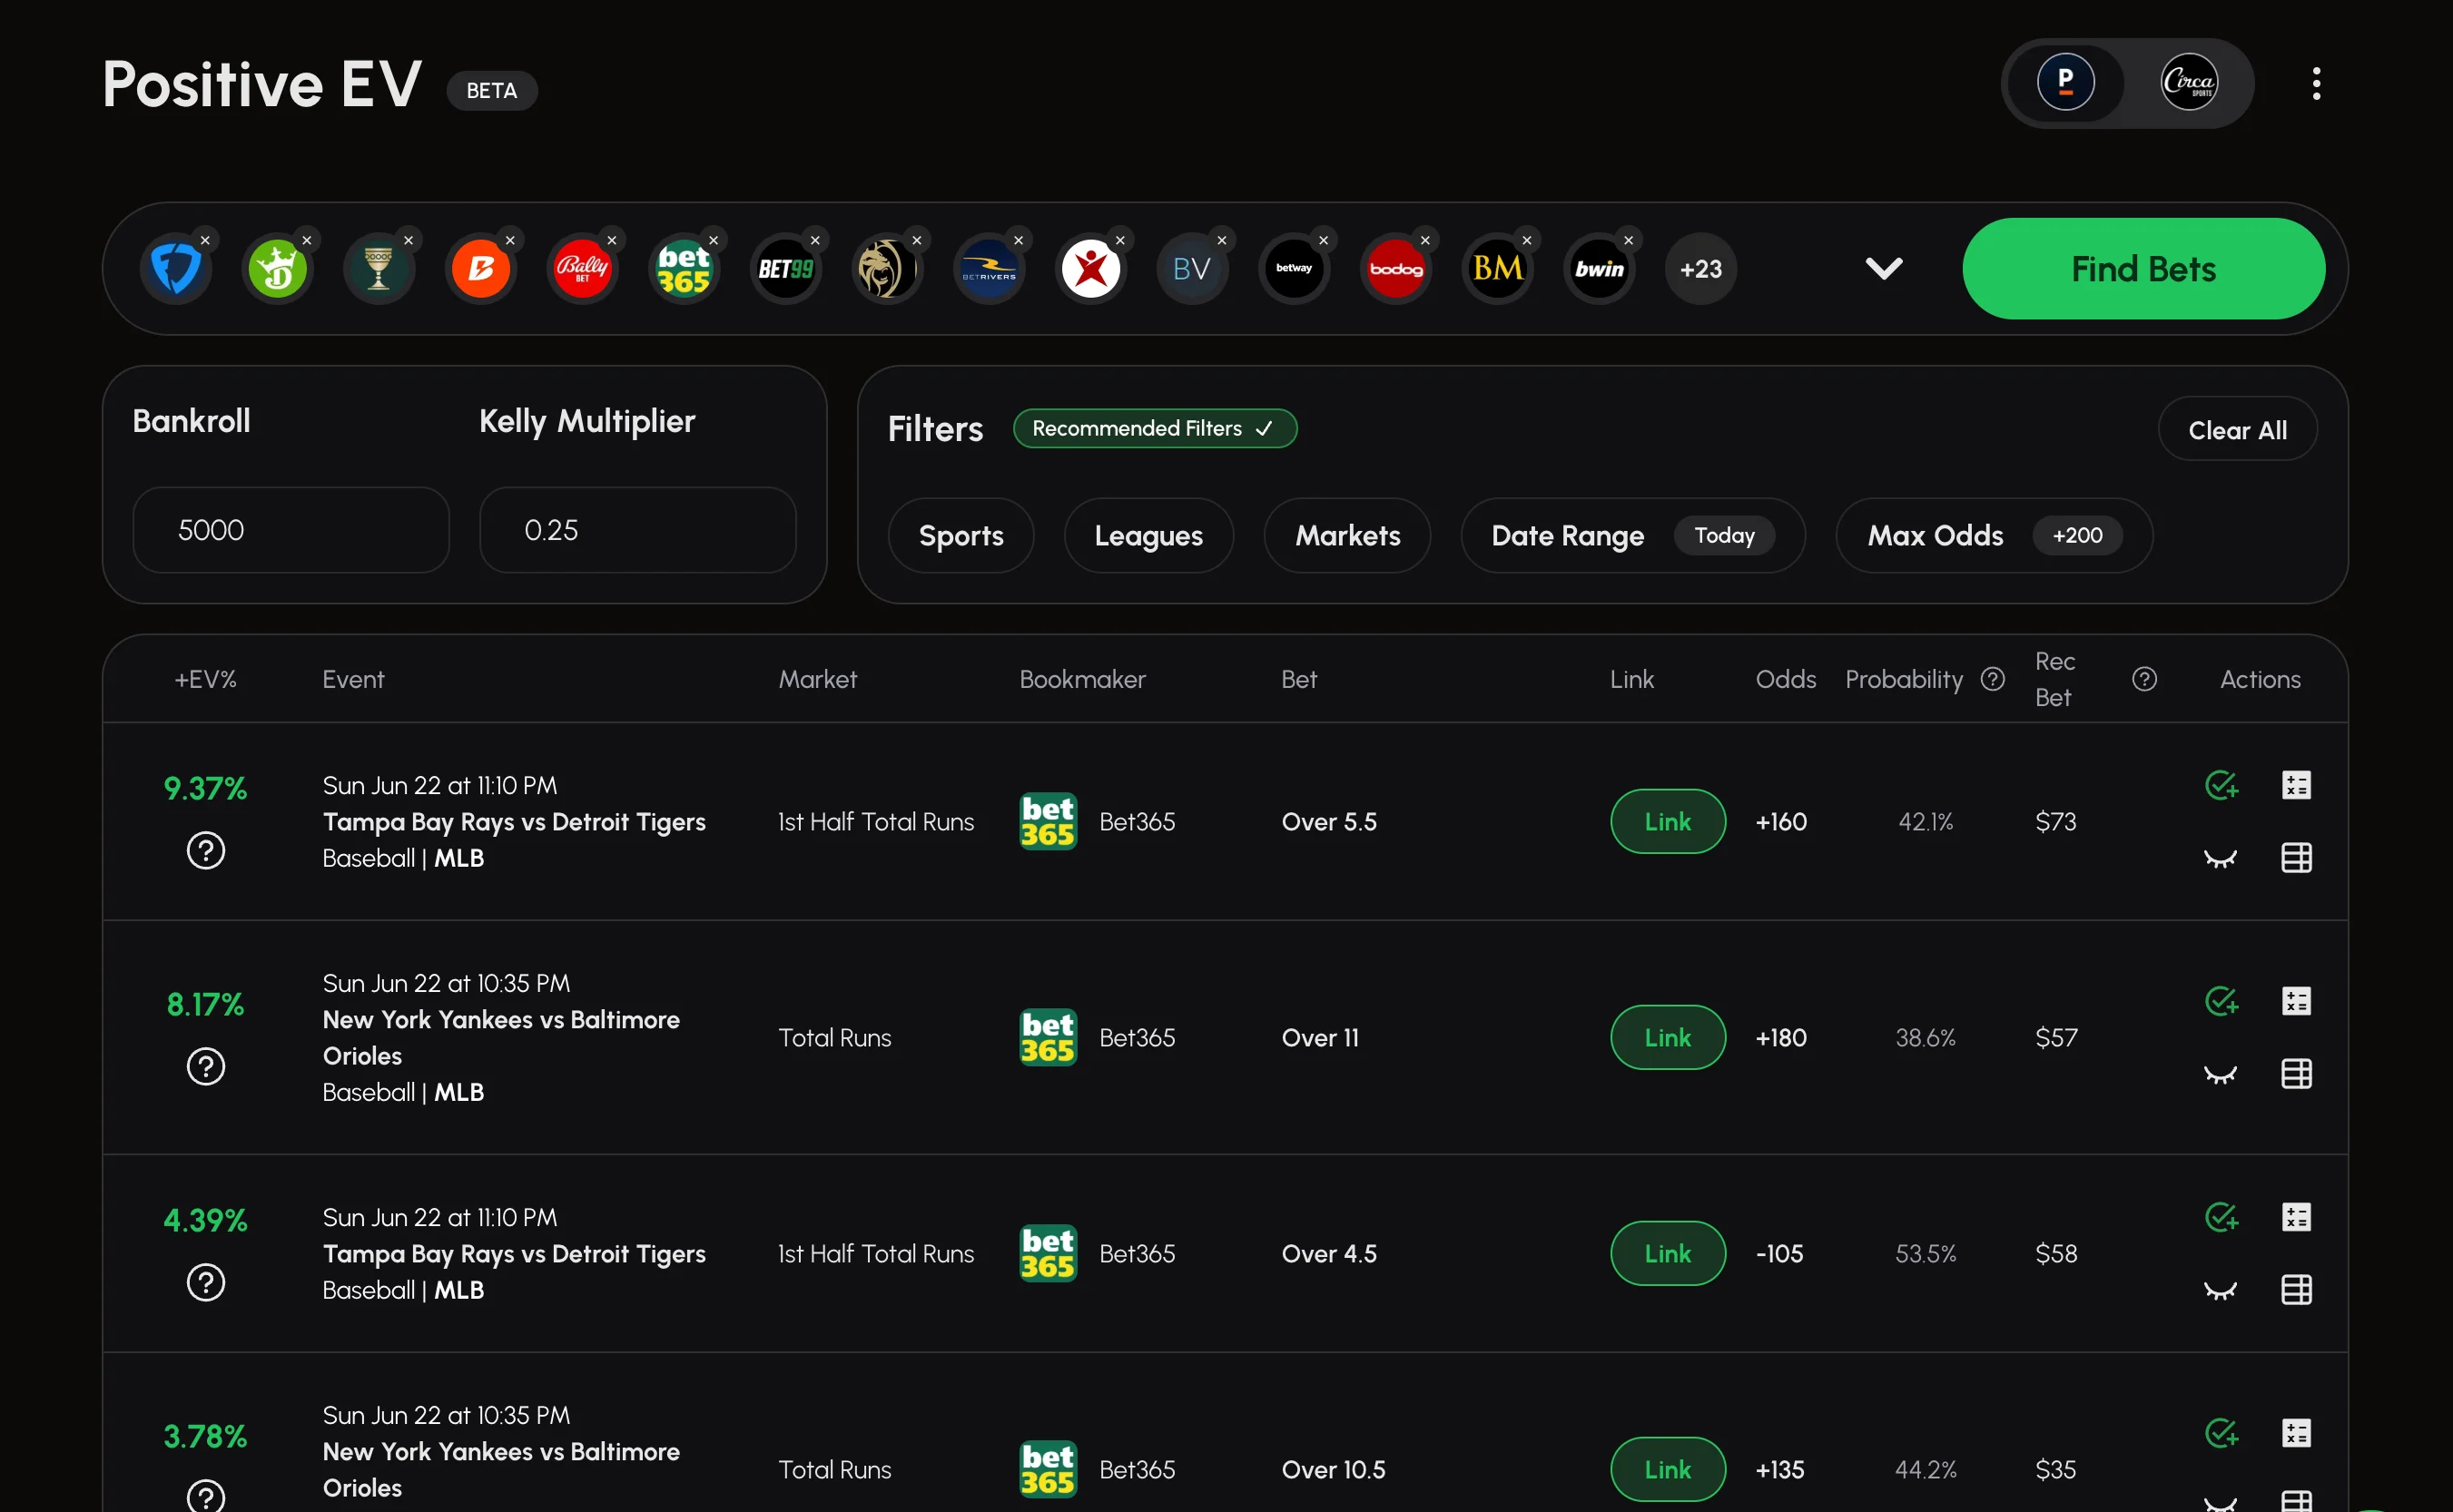
The game is about finding value, and value is a perishable commodity. Our tools help you identify +EV opportunities quickly. Plus, we have bet tracking and many more tools to help you manage your strategy. Results vary and are never guaranteed — +EV betting is a long-term approach that requires discipline and bankroll management.
Start Your Free Trial Today and See the Live +EV Opportunities for Yourself.
Want to learn more about how to use our tool? Check out our How to Use SmartStake's Positive EV Tool guide.
References
Footnotes
-
DataGolf. (2020). How Sharp Are Sports Bookmakers? An analysis of closing line value in golf betting markets. https://datagolf.com/how-sharp-are-bookmakers ↩ ↩2
-
Buchdahl, J. (2016). Pinnacle's Closing Line and Your Betting Yield. Football-Data.co.uk. https://www.football-data.co.uk/blog/pinnacle_efficiency.php ↩
This content is for educational and informational purposes only and is not financial, investment, or betting advice. Sports betting carries risk and outcomes are never guaranteed — only stake what you can afford to lose, and bet responsibly.
Get the next guide in your inbox
Practical betting guides, new tools, and product updates from the SmartStake team. Unsubscribe in one click, any time.
By providing your email, you are consenting to receive communications from SmartStake. Visit our Privacy Policy for more info
Similar articles

StrategyPositive EV
Best EV Betting Tools for Canada & Ontario in 2026
A Canada-first comparison of the best EV betting tools in 2026, scored on Ontario book coverage, sharp reference quality, speed, and price across SmartStake, OddsJam, Betstamp, RebelBetting, DarkHorse Odds, and Crazy Ninja Odds.
Jul 23, 2026 · 12 min read

StrategyPositive EV
Bankroll Management for Sports Bettors: A Practical Guide
A practical guide to sports betting bankroll management: what a bankroll is, how to size a unit, the three staking methods compared, and where the Kelly Criterion fits. Results vary and are never guaranteed.
Jul 21, 2026 · 11 min read

StrategyPositive EV
How to Build a Sports Betting Model: A Step by Step Guide
A practical, step by step guide to building a sports betting model: pick a market, gather data, choose a method, convert the output to a fair line, and find your edge. Results vary and are never guaranteed.
Jul 20, 2026 · 13 min read